Build, simulate, and analyze real-world mobility scenarios.
The agent-based transport planning software — powered by MATSim. For Windows and MacOS.
Intuitive network editor
Create and modify transport networks directly on the map with MobilityStudio’s fully interactive network editor. Smart free-hand drawing tools make it easy to add, move, or delete nodes and links with just a few clicks. Edit network geometry intuitively, adjust connections on the fly, and refine your infrastructure visually for fast and precise network design.
Public transit editor
Design and refine public transport services directly on the map using the integrated public transit editor. Add and edit stops and transit lines, modify routes by simply dragging them to new paths, and adjust stop sequences with ease. Fine-tune operations by editing schedules, adding or removing departures, modifying departure and arrival offsets, and assigning or updating vehicles — all within a single, intuitive workflow. Intuitive graphical editors are available for all other scenario components, including agents, activity facilities, traffic counts, and more.
Simply drop your MATSim files.
Your scenario opens immediately. MobilityStudio supports all key MATSim formats, including network, transit schedule, vehicle data, plans, simulation events, trips and legs files, and more.
Make use of the powerful table view.
Open elements from the map in the table view or show table elements on the map. The table view allows you to sort, filter, and easily edit elements, maintaining seamless synchronization with the graphical editor.
Seamless MATSim integration
Launch your MATSim runs directly from MobilityStudio. Seamlessly open the MATSim GUI using your own embedded JAR file, eliminating the need to manually switch environments and ensuring you can test and iterate your models instantly. Make use of our open-source MATSim config editor to configure your simulation runs. Open the simulation outputs directly from within the app.
Visualize your simulation results.
Load the simulation events and experience the dynamics of your models in a fluid live animation. Use the time slider and playback controls for detailed investigation of traffic flow. Find any person/agent and follow their movement throughout the entire simulation run.
Achieving quick results is easy.
1.
Prepare your scenario.
Load and immediately begin modifying your existing MATSim files, or use the interactive graphical editor and smart tools to build your network, transit data, and population from scratch. Your data is ready in minutes.
2.
Simulate your scenario.
Seamlessly integrated into your established workflow: Export your final scenario files and run the simulation on your local machine or server. Alternatively, use MobilityStudio to launch the MATSim GUI, with your own embedded MATSim executable JAR file. Or launch your server-side simulation straight from MobilityStudio — fast, seamless, and fully under your control.
3.
Analyze and visualize.
Once the simulation is complete, instantly drag-and-drop the output event files to visualize vehicle and person movements, agent activities etc. Leverage powerful analysis tools like link volumes, spider analysis, or use the run statistics panel for a complete overview.
MobilityStudio can do even more.

Seamless MATSim Integration
Launch your MATSim runs directly from MobilityStudio, on a local machine or on a server. Seamlessly open the MATSim GUI using your own embedded JAR file, eliminating the need to manually switch environments and ensuring you can test and iterate your models instantly.

Configure On-Demand Simulations (MATSim DRT support)
Explore and simulate innovative mobility concepts such as on-demand transport, shared autonomous vehicles, and ride-pooling. Define service areas, vehicle fleets, and virtual stops… and you’re ready to run MATSim’s DRT module.

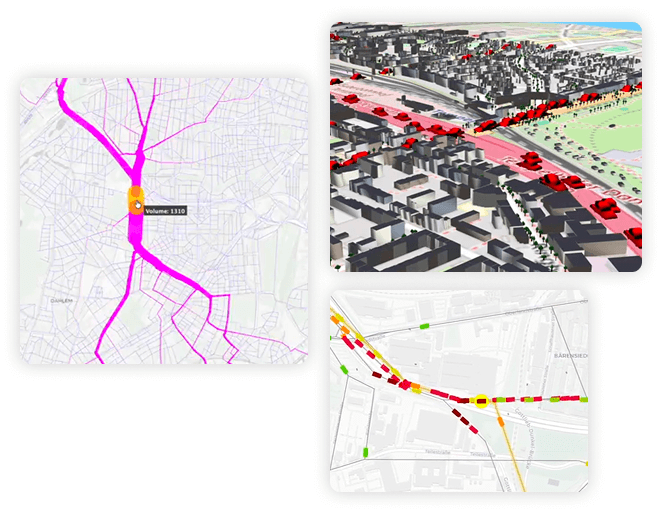
Spider Analysis
Unlock critical network insights. Click on any link to instantly visualize and display the car or transit passenger flows across the network that utilize that specific link.

Population Editor
Take full control of your agent data. Easily create, clone, or delete persons and edit their daily plans directly within the application. This is essential for scenario adjustments, sensitivity analysis, and focused simulation testing.

Traffic Counts
Add and edit traffic count stations using an intuitive graphical editor. Interactively explore statistics and compare simulated traffic volumes with measured data to validate results and assess model performance. Time to calibrate your model!

Transit Schedule Editor
Easily create or edit your transit schedule: Add or remove transit stops, cut or trim transit lines, or automatically generate routes between stops. Smart free-hand tools allow you to easily create or edit transit lines.

Transit Network Graphics
Have a look into your transit data. Open selected transit lines in a simplified network graphic view to inspect stops, route sequences, and frequencies without the distraction of the full scenario map.

Table View
Open elements from the map in the table view or show table elements on the map. The table view allows to sort, filter, and easily edit element properties in bulk, maintaining seamless synchronization with the graphical editor.

Customized Styles
Customize your layer styles with rules. Transform raw data into compelling, readable visualizations by defining rules for color, symbol, size, and label of every element. Styles can be saved and reused across projects.

Background Maps
Provides background maps, e.g., OpenStreetMap, including elevation data and 3D elements. MobilityStudio manages Coordinate Reference Systems for precise data alignment.

3D Viewer
No, the earth isn’t flat! Visualize scenarios in an interactive 3D environment featuring realistic terrain elevation and various background maps. Bring your simulation to life with 3D buildings, trees and vehicle animation.

Save and Export Views
Maintain the perfect perspective. Save and export your precise camera coordinates to quickly restore specific viewpoints across different projects, ensuring consistent and professional visualizations every time.

Create Difference Plots
Compare multiple scenarios and generate clear difference plots to visualize changes in traffic volumes. Quickly see how traffic patterns differ between scenarios for easy analysis.

Analyze Trip and Leg Flows
Load MATSim trips and legs csv files together with your own polygon shapefile to filter, aggregate, and visualize transport flows. Seamlessly switch between trips, legs, and simulated vehicles to explore mobility patterns from multiple perspectives.

Detailed Statistics
Gain immediate insights into your simulation results with comprehensive and detailed statistics. Explore aggregated metrics such as trips per mode, as well as boarding and alighting passengers per stop, hourly traffic volumes, and more. Visualize key indicators through clear charts to quickly evaluate and validate transport demand
Explore more features and visit our Feature Handbook.

Our Mission: Advanced Transport Modeling with MATSim. Made Easy.
The power of the MATSim simulation engine is undeniable. MATSim, the world’s leading agent-based transport modeling framework, provides the microscopic precision essential for strategic, data-driven transport planning. Our mission is to make use of that power.
We are committed to stripping away complexity, transforming intricate XML data into an intuitive graphical interface. MobilityStudio is the tool that ensures faster scenario iteration, clearer analysis, and a lower barrier to entry, allowing experts and newcomers alike to focus solely on their core research and planning challenges.
Are you ready to take the next step?
Unlock the full potential of your transport planning projects today. Experience the powerful interactive editor, advanced visualization tools, and a streamlined workflow. Start with a free trial to explore the features, or choose an annual license to integrate MobilityStudio into your daily work.